


BESS Investment Proposal
0. Overview
0. Overview
Defines Revenue
Based on Equipment Qty
Total Energy
93.05% of Nominal
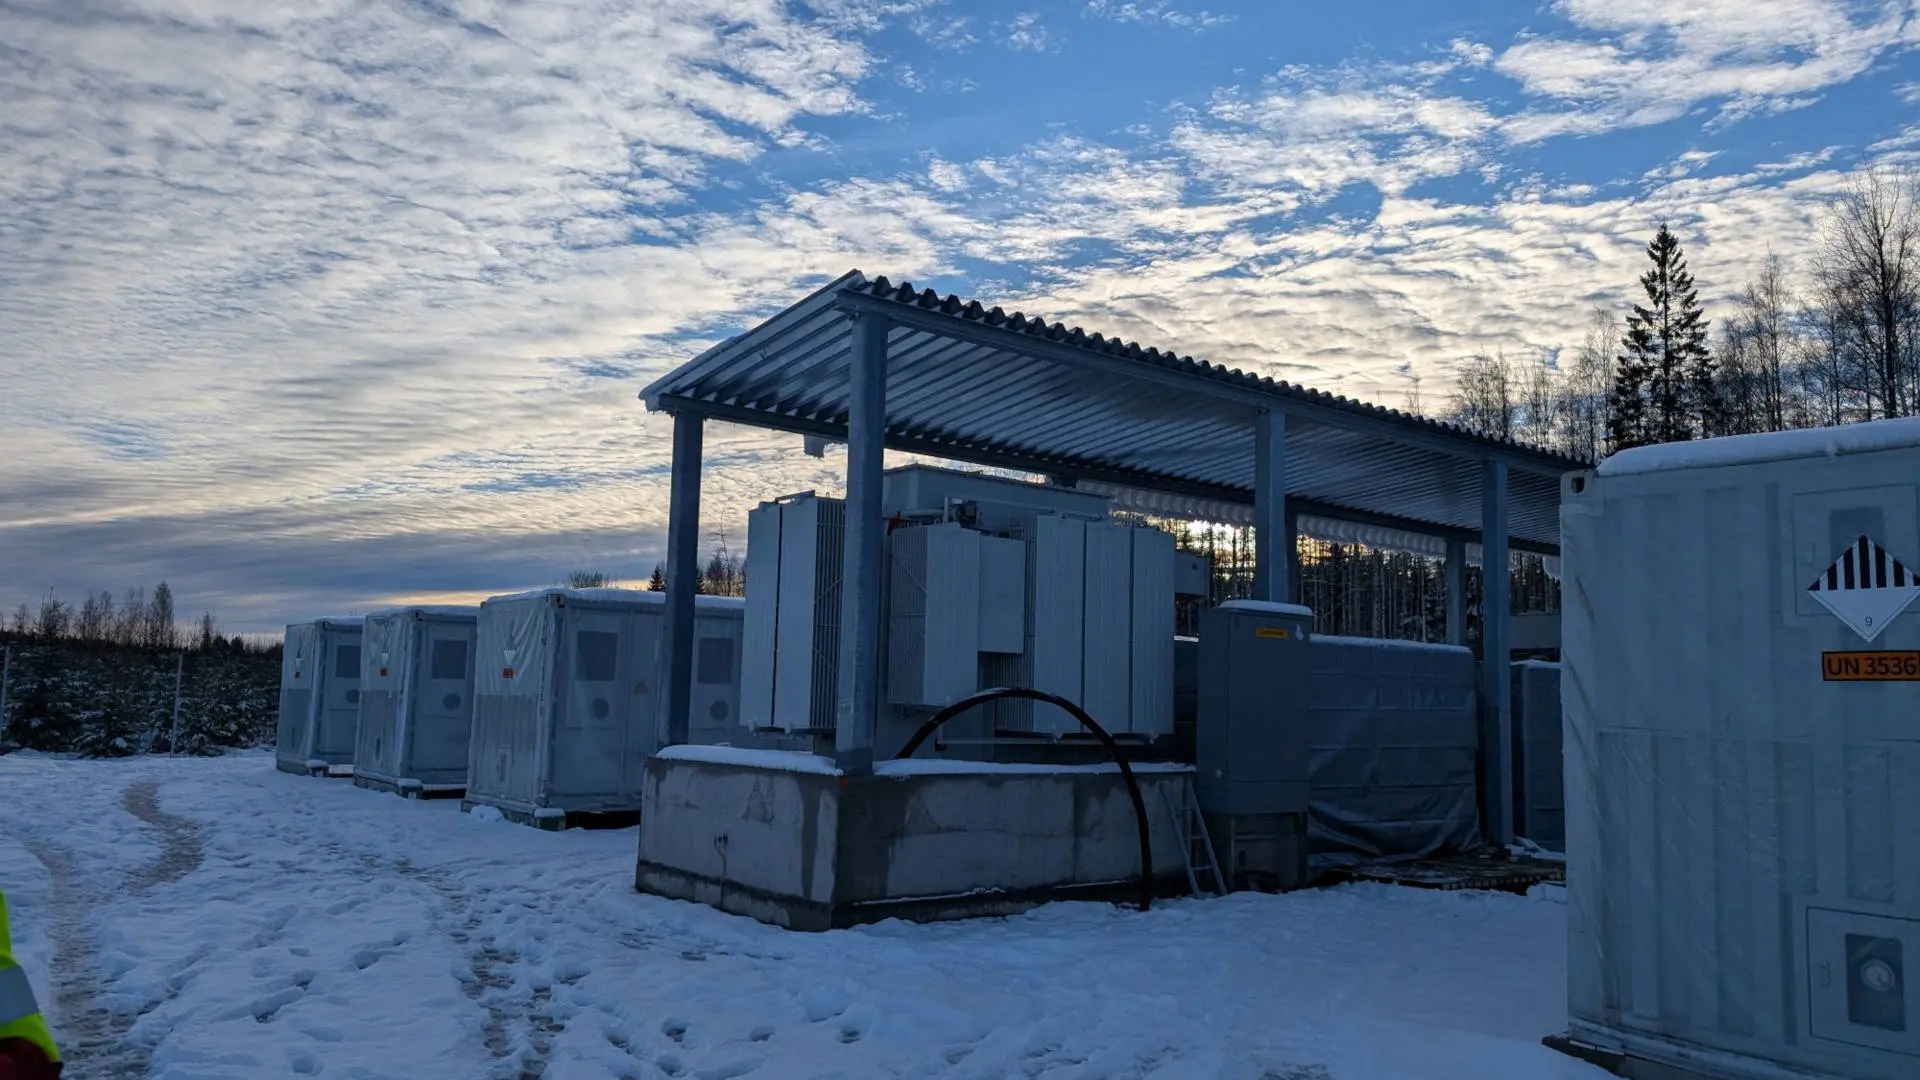
1. Plant & Logistics
1. Plant & Logistics
BESS Plant (Containers)
MV Station (Containers)
Logistics Inputs
Total Plant DDP
€1,094,931
109.17 €/kWh
2. Capacity & Cycle Life
2. Capacity & Cycle Life
Linked to Section 1
Calculated from Cycles
Fixed
Capacity Evaluation: The capacity evaluation point is at the MV POC, including the auxiliary electrical loss and internal consumption.
Cycle Life: Cells are rated to 10,000 full cycles (0.5P 25°C 100% DOD) to more than 70% of initial capacity. In normal operating conditions, ESS is rated at 10,000 full cycles over 12 to 15 years to more than 70% of initial capacity.
Utilization: Average utilization for spot and reserve markets estimated at 1.5 cycles per day.
Degradation Curve (15 Years)
Capacity Table
| Year | SOH % | Nominal | Usable |
|---|---|---|---|
| Year 0 | 100.0% | 10.03 | 9.33 |
| Year 1 | 98.4% | 9.87 | 9.17 |
| Year 2 | 96.7% | 9.70 | 9.02 |
| Year 3 | 95.1% | 9.54 | 8.87 |
| Year 4 | 93.4% | 9.37 | 8.72 |
| Year 5 | 91.8% | 9.21 | 8.56 |
| Year 6 | 90.1% | 9.04 | 8.41 |
| Year 7 | 88.5% | 8.88 | 8.26 |
| Year 8 | 86.9% | 8.71 | 8.10 |
| Year 9 | 85.2% | 8.55 | 7.95 |
| Year 10 | 83.6% | 8.38 | 7.80 |
| Year 11 | 81.9% | 8.22 | 7.64 |
| Year 12 | 80.3% | 8.05 | 7.49 |
| Year 13 | 78.6% | 7.89 | 7.34 |
| Year 14 | 77.0% | 7.72 | 7.18 |
| Year 15 | 75.4% | 7.56 | 7.03 |
3. SCADA & Compliance
3. SCADA & Compliance
| Item | Cost (€) |
|---|---|
| Site Energy Controller & SCADA | |
| Simulation Models (PSCAD/PSSE) | |
| Grid Compliance Testing | |
| EMS Integration | |
| TOTAL SCADA | €80,000 |
4. EPC & Other Costs
4. EPC & Other Costs
engineering EPC & Civil Inputs
folder_open Other Costs
5. Schedule & Capital
5. Schedule & Capital
calendar_month Project Timeline
pie_chart Use of Funds & Capital
€1,600,000
Use of funds: Funder 3 contribution will be used for Bess plant budget. Founders contribution will be used for EPC , SCADA and other costs, and for the balance of Bess plant budget
6. Project Financials
6. Project Financials
payments Operational Expenditure (Annual)
tune Global Parameters
Revenue / MW (Uses Grid Limit)
Cumulative Return
Annual Breakdown
| Metric | Y1 | Y2 | Y3 | Y4 | Y5 | Y6 | Y7 | Y8 | Y9 | Y10 |
|---|---|---|---|---|---|---|---|---|---|---|
| Revenue | 710,000 | 695,000 | 660,000 | 650,000 | 650,000 | 650,000 | 650,000 | 650,000 | 650,000 | 650,000 |
| Opex | -54,040 | -54,040 | -54,040 | -54,040 | -54,040 | -54,040 | -54,040 | -54,040 | -54,040 | -54,040 |
| EBITDA | 655,960 | 640,960 | 605,960 | 595,960 | 595,960 | 595,960 | 595,960 | 595,960 | 595,960 | 595,960 |
| Depreciation | -218,986 | -218,986 | -218,986 | -218,986 | -218,986 | 0 | 0 | 0 | 0 | 0 |
| EBIT | 436,974 | 421,974 | 386,974 | 376,974 | 376,974 | 595,960 | 595,960 | 595,960 | 595,960 | 595,960 |
| Corp Tax | -89,580 | -86,505 | -79,330 | -77,280 | -77,280 | -122,172 | -122,172 | -122,172 | -122,172 | -122,172 |
| Profit After Tax | 566,381 | 554,456 | 526,631 | 518,681 | 518,681 | 473,788 | 473,788 | 473,788 | 473,788 | 473,788 |
| Loan Repayment | -533,333 | -533,333 | -533,333 | 0 | 0 | 0 | 0 | 0 | 0 | 0 |
| Dividends | 33,047 | 21,122 | -6,703 | 518,681 | 518,681 | 473,788 | 473,788 | 473,788 | 473,788 | 473,788 |
| Total Return | 566,381 | 554,456 | 526,631 | 518,681 | 518,681 | 473,788 | 473,788 | 473,788 | 473,788 | 473,788 |
| Cumulative ROI | 35% | 70% | 103% | 135% | 168% | 197% | 227% | 257% | 286% | 316% |